
How to Find Best-Selling Products Using Lazada's Business Advisor Tool
If you are a seller on Lazada and have access to its Seller Center, then you probably know about the Business Advisor tool.
Today we are going to look at a very simple technique on how to check (and improve!) your shop's performance using real data that you can export from this really amazing tool.
It's a 5 step process, at the end of which you will be able to answer:
A) Which products are driving the highest % of traffic for your shop?
B) What metrics are your products struggling with?
C) Which products might be your next "Hero Products" ?
Before we begin, it's important for us to remind ourselves the formula to calculate sales:
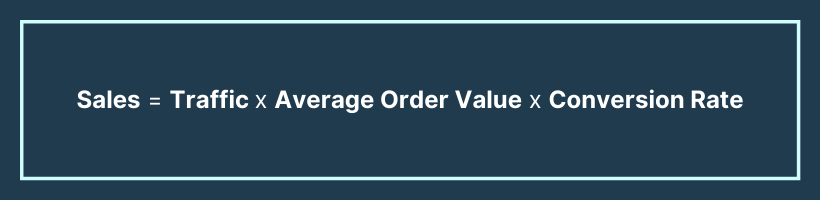
Therefore, the 3 key metrics that we are looking for whenever we sift through data, are always Traffic, Average Order Value, and Conversion Rate.
In order to increase sales, we need to increase any one or more of these metrics.
Let's begin with our analysis!
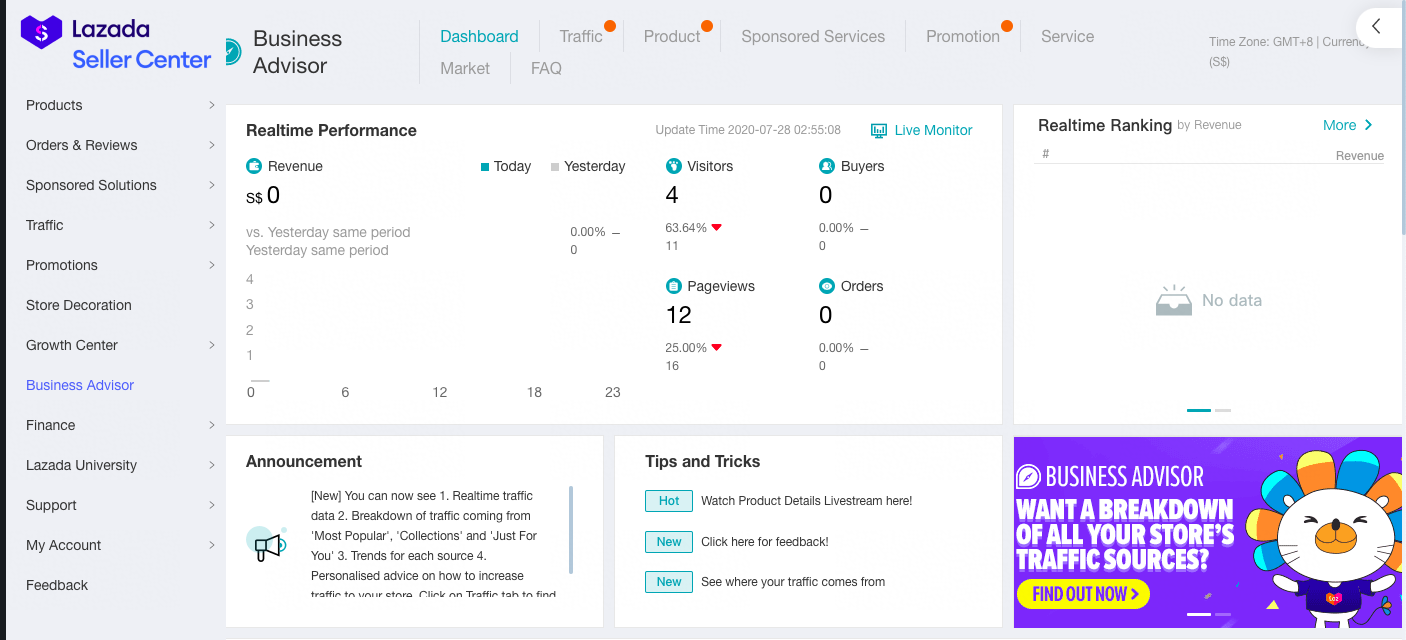
Step 1: Looking for Data in the Right Place
First of all, sign in to your Lazada Seller Center and go to Business Advisor.
Go to the "Product" tab > Performance > In the "Date" Section, select the previous month.
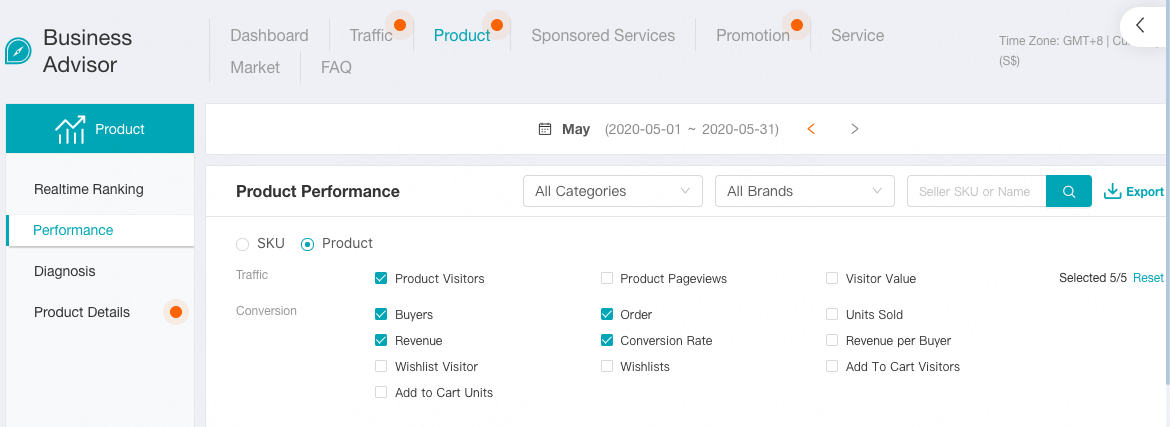
Under the "Product Performance" you'll see an option to select either SKU or Product. Depending on your choice, the data you export will either show under SKU codes or product names.
The values are all the same, so this only depends on what terms you are more comfortable with.
Don't worry about choosing other metrics in the "Traffic" and "Conversion" sections, because regardless of your choice, all the data will be shown in the sheet when you export.
Step 2: Extracting Data From Excel
Export the data, and open up the downloaded Excel file.
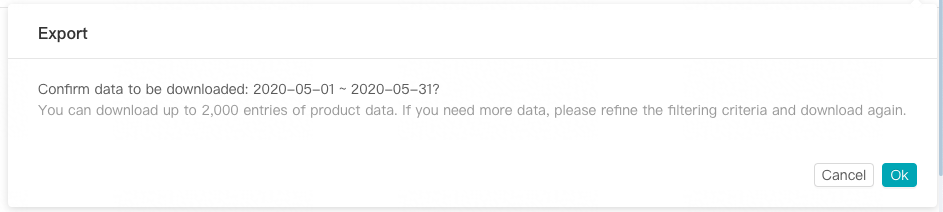
The Excel file will look a little bit overwhelming, but worry not, the following steps will make reading your data much easier!
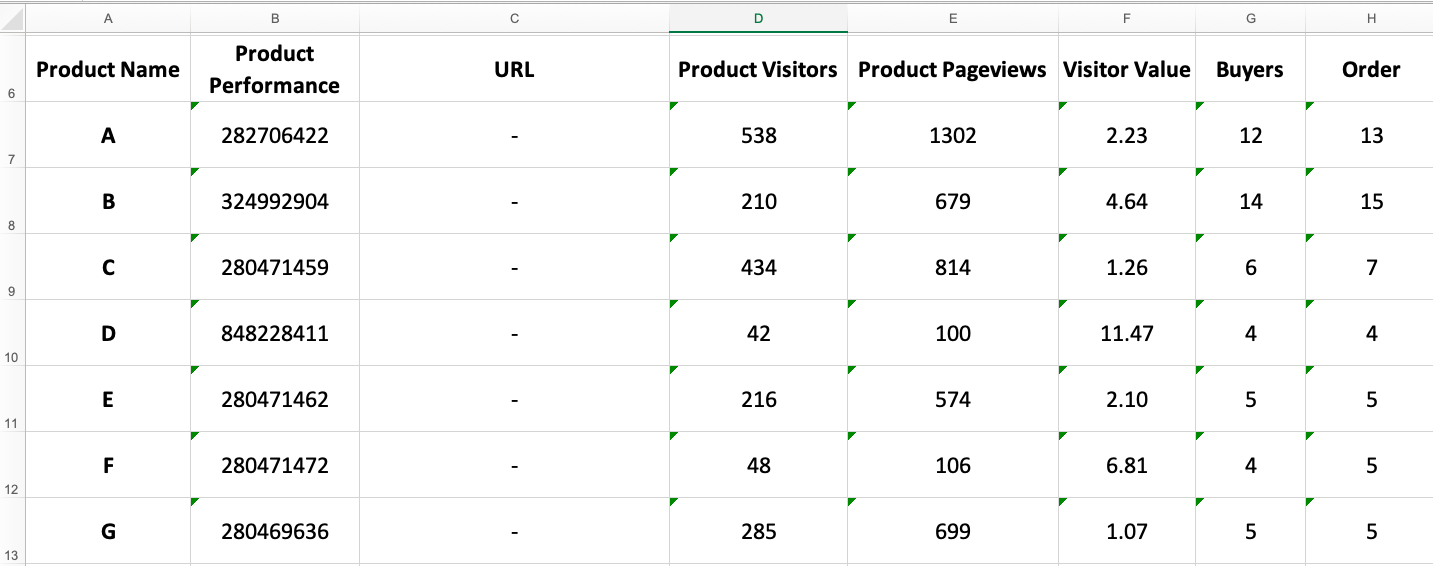
If you're using Microsoft Excel, you will notice that all the numerical values have a green tag on them. This is because all these numbers are stored as text.
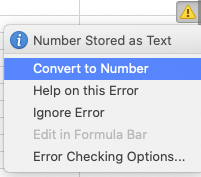
For us to continue, we need to change the format of these cells to numbers. The simplest way to do so is by:
a) Click on any cell with the green tag, and press on "Control (Ctrl/control)" + "A" - This will select all the cells in the sheet.
b) You will see a small information (⚠️) icon on the left/right (edges). Click on it, and select "Change to Number" and voilà! ~ Now all the numbers in your sheet are in the correct format.
Step 3: Calculating the Data
Within the export file, hide all the following columns: (To do so, just right-click the at the top of the column and click "hide")
- Product Performance
- URL
- Visitor Value
- Order
- Revenue per Buyer
- Wishlist Visitor
- Wishlists
- Add To Cart Visitors
- Add to Cart Units
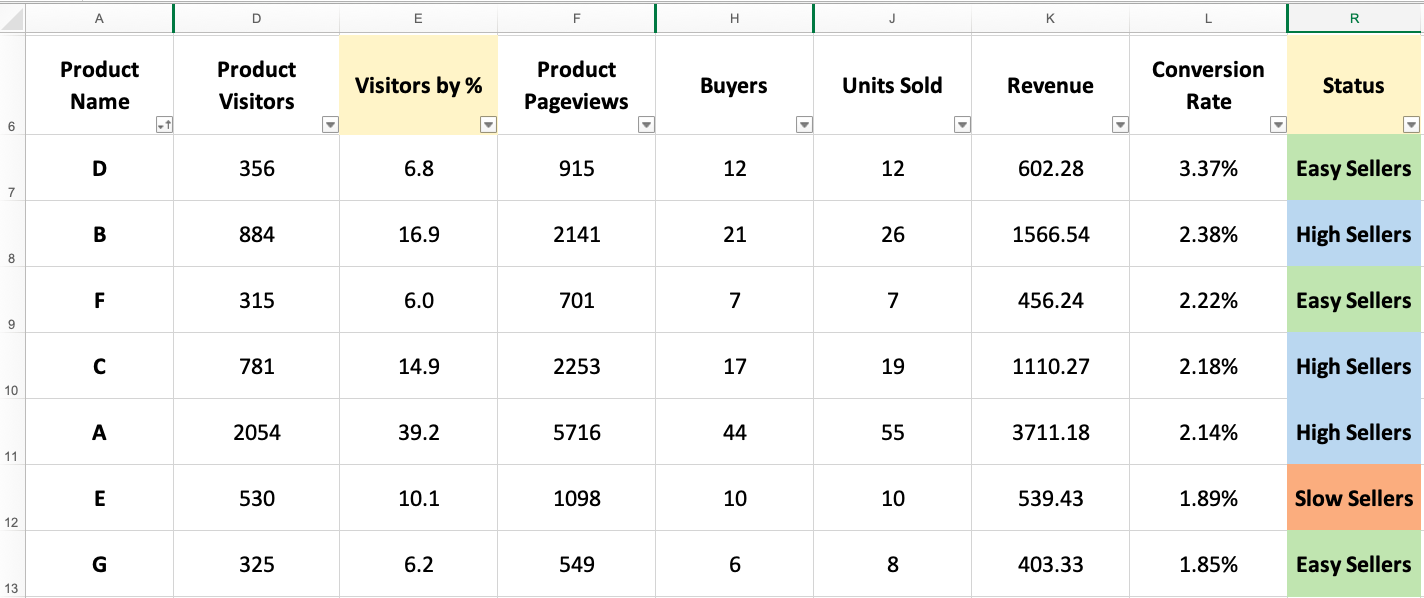
Now you will just see these remaining columns:
- Product Name (and Seller SKU when you use it)
- SKU Views
- SKU Visitors
- Buyers
- Units Sold
- Conversion Rate
- Revenue
We also need two additional columns:
-
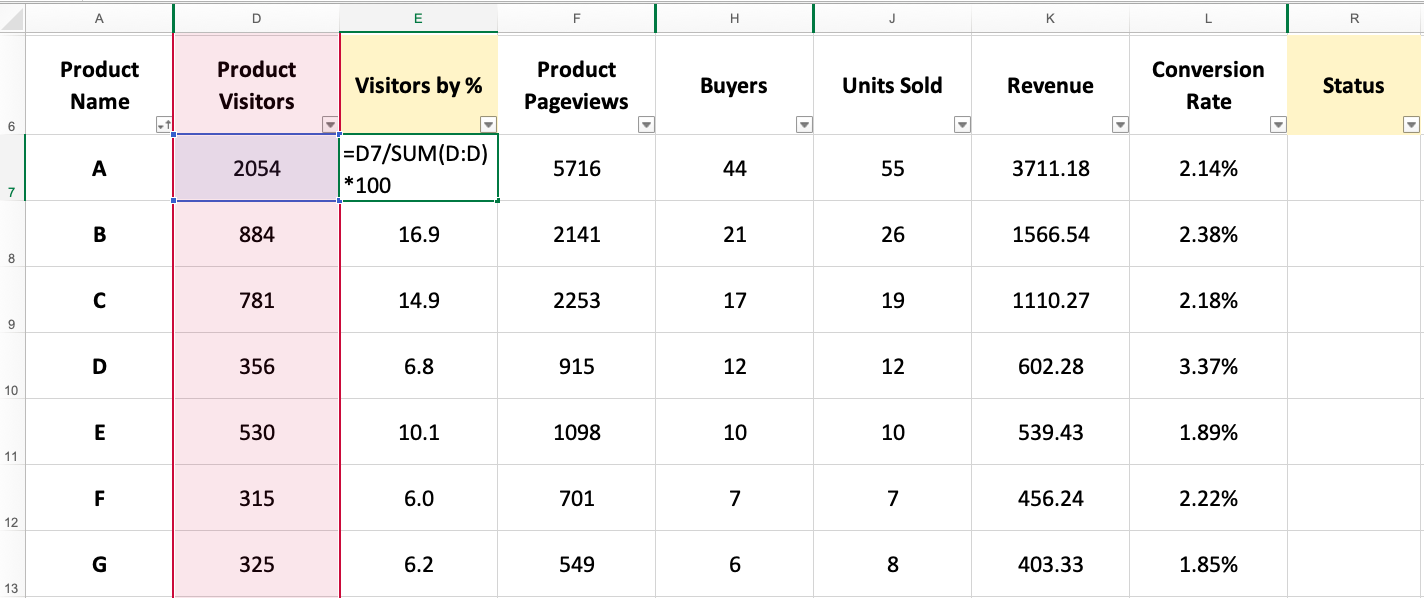
Visitors by %:
Helps us identify how much traffic is each product responsible for, compared to the overall traffic. This plays an important role when you want to set a threshold cut off.For example:, only products that are responsible for more than 30% of the shop traffic need to be prioritised.
Add this new column next to "SKU Visitors" in Column E -
Status:
A simple text column, which we will use later to categorise our products.
Add this new column in Column R
In cell E7, add the following formula to calculate the Visitors by %:
=D7/SUM(D:D)*100
(The above formula works, assuming that Column D is the "Product Visitors Column", and D7 is the first value in it.)
Once you have put in the formula, just drag it through for all the remaining cells in the sheet.
The values can be rounded up for a cleaner look, but we personally prefer to keep them to 1 decimal space.
Step 4: Identifying Target Products
Now that the sheet is ready, we can start identifying our target products in the following three types:
A) The Best Sellers: High Traffic / High Conversion
B) The Slow Sellers: High Traffic / Low Conversion
C) The Easy Sellers: Low Traffic / High Conversion
To identify the above types, we will need to do something called "multi-level sorting."
Basically what this means is that we are able to sort our data showing highest traffic on top, and within that, arranging the products to also show the highest conversion rates.
Here is how to do multi-level sorting using the dialog box:
- Select the entire data set.
- Click the "Data" tab.
- Click on the "Sort" Icon (the one shown above). This will open a dialogue box.
- In the dialogue box, make the selections as shown below. (Each type of products have different selections to help us identify them).
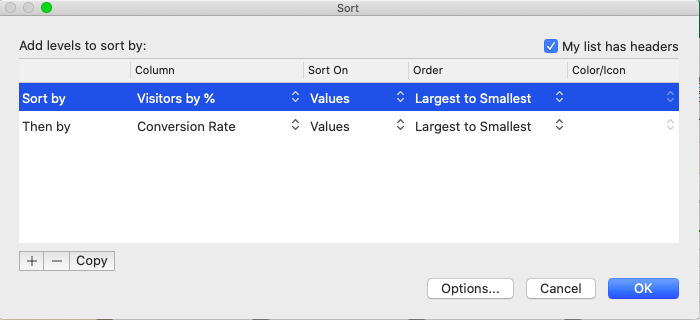
Category A - The Best Sellers
The Best Sellers are the products that generally have Good Traffic and Good Conversion Rates, hence they have good Sales.
Category B - The Slow Sellers
The Slow Sellers are products which have high traffic but are still not able to sell well (Low Conversion).
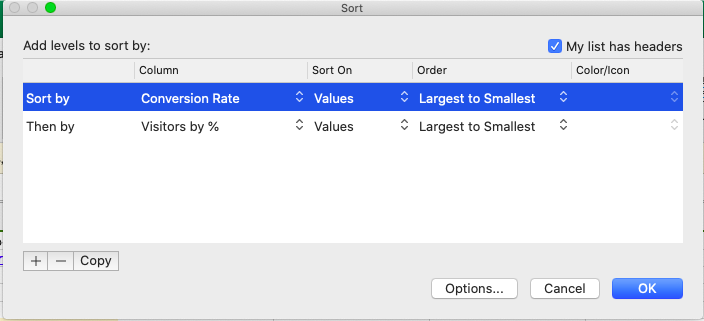
Category C - The Easy Sellers

The Easy Sellers are high conversion products with low traffic, and are bound to be your next line of best sellers!
As you choose and tag the products, you might notice that in some cases the tags overlap, Best Sellers might also be Easy Sellers and that's why it's important for you to set a threshold (a cut-off point which helps you choose) for each category of products.
For Best Sellers, we like to set the "Minimum Revenue" value as the threshold,
While there are many ways of finding this value, here's a simple example of how it works:
-
Shop revenue in the last 30 Days = $10,000
-
Number of products in my shop = 25
-
Average revenue per product = $10,000 / 25 = $400
So if a product does not have a minimum of $400 in revenue, we will not focus on it.
Similarly for "Slow Sellers," we prefer to set "Traffic" as the threshold, but for "Easy Sellers" we go with "Number of Buyers" as the threshold.
The thresholds you choose for each shop can differ because the same approach is not always appropriate.
For e.g., it's possible that three high-value products make most of the revenue, while the others have high units sold but lower revenue. In that case, if you use the revenue threshold, only those 3 products will show as the best sellers.
That's why it's important for you to consider multiple factors, such as the value of your products, and the revenue they generate per sale when choosing the right threshold for your products.
After you have identified the threshold, you can scan through the sorted data and tag the products accordingly using the "Status" column.
Step 5: Strategizing your marketing plan with the final data
Now that you have a clear categorised list of the products that need the most attention, the next step is to place each product where it needs to be, in order to make it into a bestseller.
Best Sellers
You can focus on these products when planning your marketing activities and choosing your hero products for mega campaigns.
The key is to maintain these products at the level they are, and use them as the anchors of your shop. The goal should be to convert the other products also into best sellers.
Slow Sellers
Now that you've identified these products, you can focus on finding out why people are not buying these products (Price? Stock? Reviews?), and improve them.
At the same time, you can start removing these products from paid marketing campaigns and invest in other products like the ones in Category C, the Easy Sellers.
Easy Sellers
The Easy Sellers are one of the main reasons why this simple exercise of regular performance check can be very profitable!
These products are great sellers but do not have enough traffic being directed towards them.
Therefore, by simply increasing the marketing efforts, you will be able to greatly increase the number of sales and revenue these products generate, and might even be able to convert them into best sellers.
Using data can be a very insightful tool when trying to boost your shop's growth, but at the same time, it's important to remember that your intuition is also very important. When you put data and intuition together to make well informed product decisions, they can help your Lazada shop tremendously.
Taking the Next Big Step
We hope that the article above is helpful and inspires you to take action when it matters most. Running a successful online shop is tough work and we are here for you!

At Leap, we are a team of professional e-commerce specialists, who guide entrepreneurs and businesses of all sizes. If you are looking for help to get started or grow you online business, let's get on a quick call to discuss how we can assist you.